

Maintenance Dashboard
Maintenance Dashboard is a centralized dashboard that provides key insights into the maintenance and performance of industrial assets such as Asset health, Maintenance cost, and so on to plant engineers and managers.
The Maintenance dashboard effectively tracks KPIs and provides actionable insights to optimize asset performance and thereby reduce operational risks. Maintenance Insights play an important role in APM by providing actionable information and data-driven insights to support maintenance decision-making.
To access Predictive Maintenance Workplace, go to Genix Platform > Digital App Center > My Apps > APM Model Configuration and Deployment > Monitor and Optimize > Maintenance Dashboard.
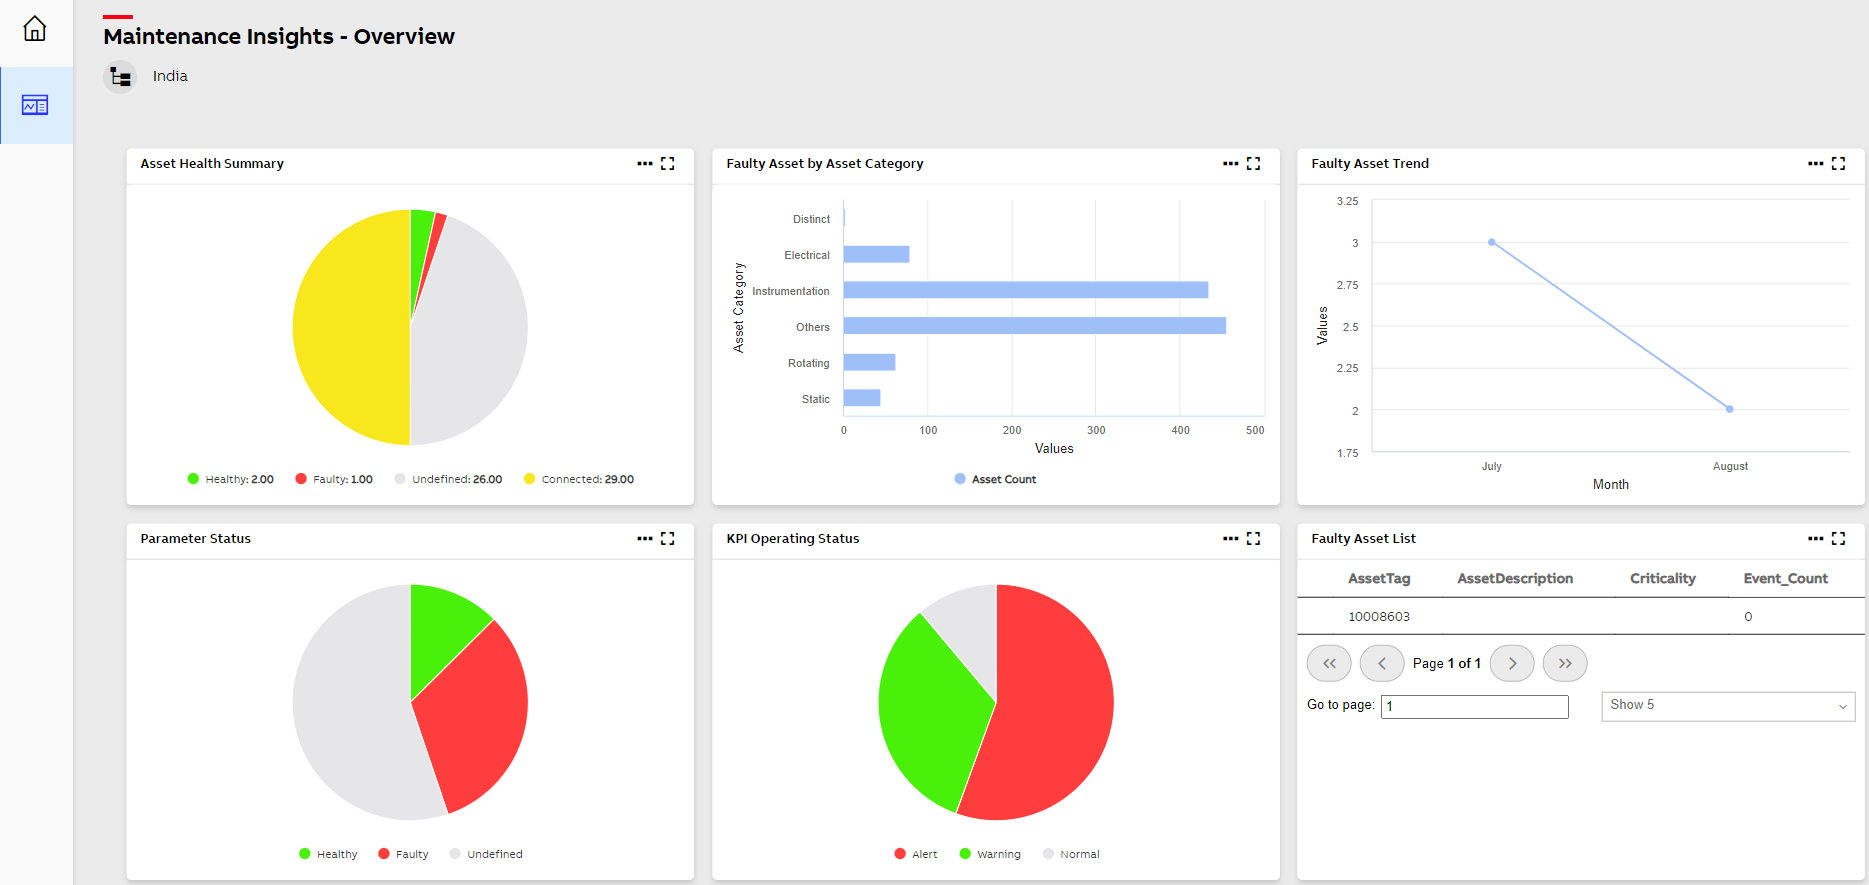
Following are some important KPIs that are available as default with Genix APM application:
-
Asset Health Summary
-
Faulty Asset by Asset Category
-
Faulty Asset Trend
-
Parameter Status
-
KPI Operating Status
-
Faulty Asset List
-
Total Cost
-
Material Cost
-
Service Cost
-
Actual vs Budgeted Expense
Maintenance Insights Overview
This data can be visualized on the Maintenance Dashboard and 'Refresh' frequency of dashboard is customized as per customer's configuration.
The 'Refresh' frequency can be set to daily or shift basis as per the customer configuration (zero-day configuration). For example, 'Refresh' frequency can be set at everyday morning 12:00 am. The next refresh will be on the next day 12:00 am.